The Complexity of the International Student Experience
When I first skimmed the survey response, the word that caught my attention was ‘financial aid.’ It was impossible to ignore this word because it appeared so many times in the answers. Naturally, the first question that I asked was, “Do international students’ experience at Bates differ by their financial status?” In particular, I decided to check whether the financial aid recipients have different experiences interacting with professors at Bates. I analyze how much students agree with the statement, “Professors at Bates interact with international students differently than they interact with domestic students,” and compare it with the number of times students mention financial aid in their survey answers.
The Appearance of Financial Aid in the Survey Response
Again, this analysis is based on the survey of International Student Need Assessment in 2019. This survey did not have a specific question about financial aid. However, students talked about financial aid often in the Short Answer Questions. In this analysis, I utilized the answers of 83 students — I excluded data of one student because the person did not answer the question except the very first section. Then, I counted all the answers that included either “financial” or “aid” without case-sensitive.
#This code navigates the number of times that the word "financial" or "aid" came out in the survey responses.
#Data frames: data, why_bates (a subset of data from the "Goals of College Education" section) and financial (a new data frame that will include the analyzed information)

#I use the for loop to navigate from the first row to the last row of the data

for(i in 1:nrow(data)){

    #assigning ID number to the row on ID

    financial$ID[i]<-row.names(data[i,])

    #grepl is a function that returns a boolean vector based on whether a string is included in the part of the comparing vector.
    #Using the grepl function, I count the occurrences of either "Financial" or "Aid" while ignoring the cases. Then, I put the result into the second column of the data frame financial.

    count<- grepl("Financial", data[i,], ignore.case = TRUE, fixed = FALSE)|grepl("Aid", data[i,], ignore.case = TRUE, fixed = FALSE)

    #Since TRUE can be numerically counted as 1 in R, I use the sum function to add the numbers of TRUEs in the vector.

    financial[i,2] <- sum(count)

    #Using the grepl function, I check if the answer in the first column of why_bates (the first important reason to attend to bates) includes either the word "Financial" or "Aid". This is not case-sensitive.

    if(grepl("Financial", why_bates[i,1], ignore.case = TRUE, fixed = FALSE)|grepl("Aid", why_bates[i,1], ignore.case = TRUE, fixed = FALSE)){

       #I impose 2 when the student says that financial aid was their primary reason to attend Bates
       financial$priority[i] <- 2

    } else if(grepl("Financial", why_bates[i,2], ignore.case = TRUE, fixed = FALSE)|grepl("Aid", why_bates[i,2], ignore.case = TRUE, fixed = FALSE)){

      #I impose 1 when the student says that financial aid was their secondary reason to attend Bates
       financial$priority[i] <- 1
    } else{

       #I impose 0 for every other circumstances
        financial$priority[i] <-0
    }
}
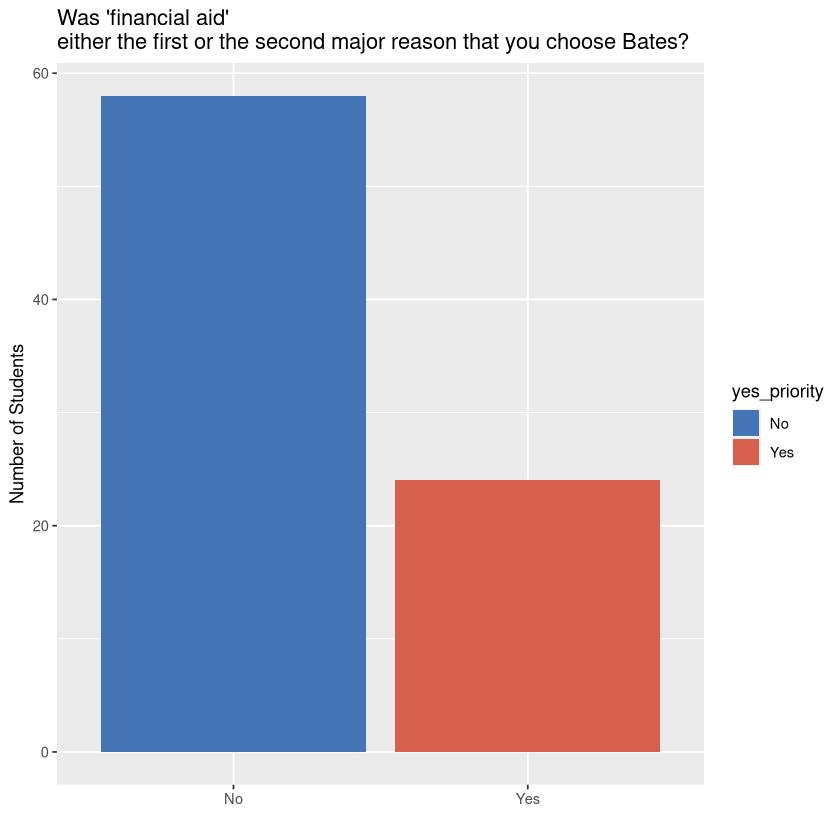
Most noticeably, 24 students out of 82 students mentioned financial aid as either first or the second most important reason that they chose Bates College. These were short answers to the question, “What were the top two reasons you chose to attend Bates?”
#Data frame: financial_or_not, which includes the column "yes_priority". This column indicates whether the student said "financial aid" as either their first or second reasons to attend Bates.
#If the student indicated financial aid as one of the reason, the value of the column is assigned as "yes". If not, it says "no"

#creating a bar graph above, while coloring No in blue and Yes to red.

b <- ggplot(data=financial_or_not,aes(yes_priority))

b + geom_bar(aes(fill=yes_priority))+
scale_fill_manual("yes_priority",values =       c("No"="#4575b4", "Yes"="#d6604d"))+
labs(title = "Was 'financial aid' \neither the first or the second major reason that you choose Bates?", x = "", y = "Number of Students")
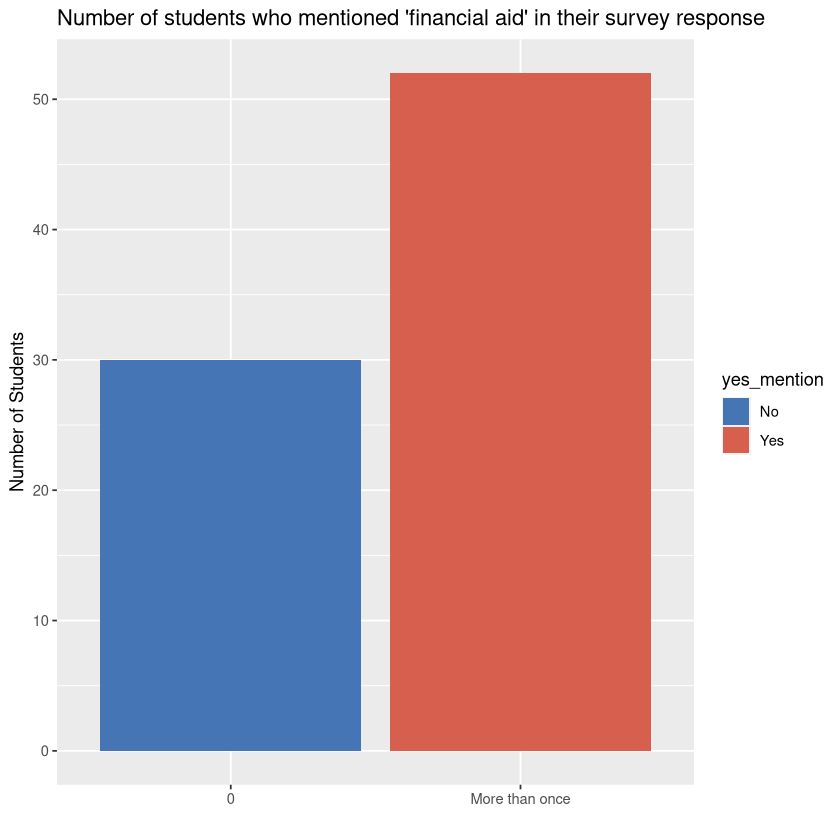
The number of students who talked about financial aid throughout the survey was even higher. 52 out of 82 students mentioned financial aid at least once in their response. The questions that they responded included “What were the top two reasons you chose to attend Bates?”, “Identify two improvements to the experience of international students at Bates you would like to see implemented,” and “Identify the resources/services that you believe should be improved or added at Bates.” (For this question, financial planning was one of the options that students can mark off)
#Data frame: financial_or_not, which includes the column "yes_mention" that indicates whether the student mentioned "financial aid" more than once in the survey.
#If the student mentioned financial aid at least once, the value of the column is "yes". If the student did not, it says "no"

#creating a bar graph above, while changing the label No to 0 in color blue and Yes to "More than once" with color red.

c<-ggplot(data=financial_or_not,aes(yes_mention))

c+geom_bar(aes(fill=yes_mention))+scale_fill_manual("yes_mention",values = c("No"="#4575b4", "Yes"="#d6604d"))+
labs(title = "Number of students who mentioned 'financial aid' in their survey response", x = "", y = "Number of Students")+
scale_x_discrete(limit = c("No", "Yes"), labels= c("0", "More than once"))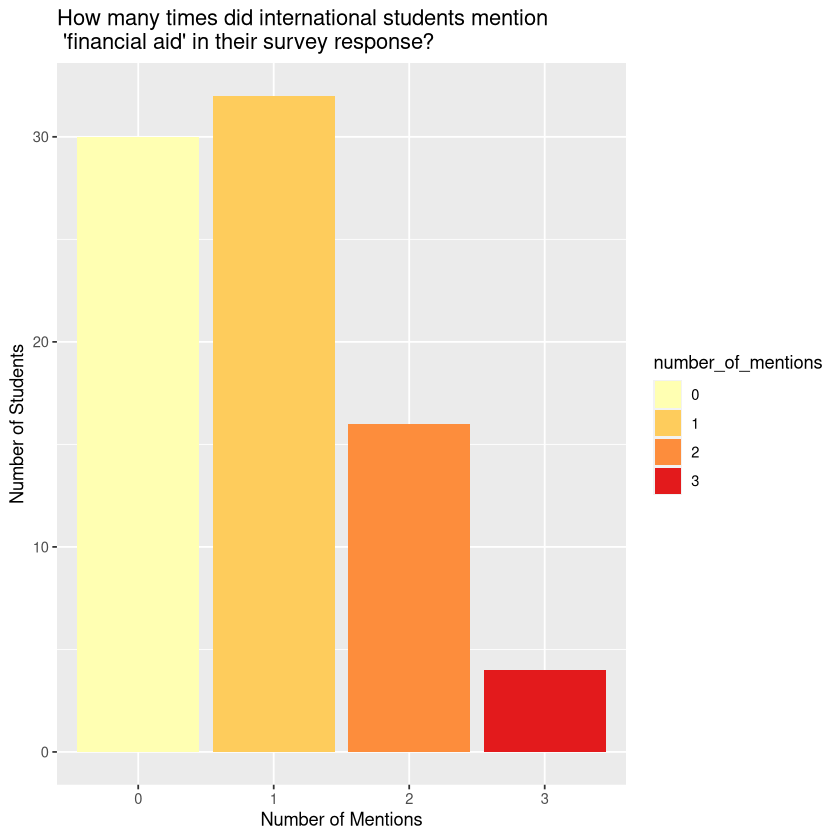
#Data frame: financial_or_not, which includes the column  "number_of_mentions"
#"number_of_mentions" has information about how often students mentioned financial aid in the survey

#creating a bar graph above on the number of students for each value of the number_of_mentions. I colored with Brewer's palette "YlOrRd"

s<-ggplot(data=financial_or_not, aes(number_of_mentions))

s+geom_bar(width=0.9, aes(fill=number_of_mentions))+
labs(title = "How many times did international students mention \n 'financial aid' in their survey response?", x = "Number of Mentions", y = "Number of Students")+
scale_fill_brewer(palette="YlOrRd")
In order to analyze the relationship between the number of mentions about financial aid in the response and prioritizing financial aid their reasons to choose Bates, I conducted a linear regression of the two variables. To numerically analyze the data, I assigned 2 when someone said that financial aid was their first reason and gave 1 to those it is the second reason.
#I did a linear regression analysis between the number of mentions about financial aid in students' response and how high student ranked financial aid as their reason to choose Bates

lm(number_of_mentions~priority, data=financial)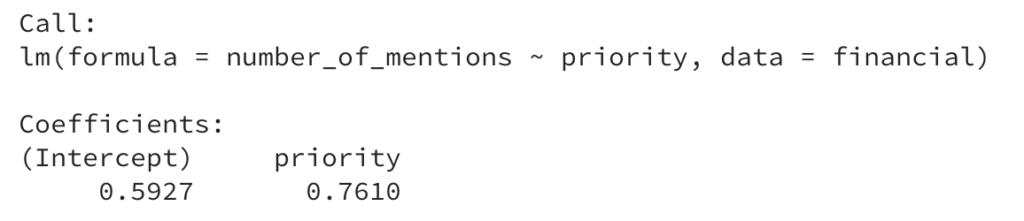
Unfortunately, the linear regression does not indicate the p-value of the intercept. I suspect it is either due to the lack of data or having only one variable to the equation. Yet, this analysis still shows a positive relationship (0.5927) between the two factors. In other words, the frequency of students talking about financial aid increases when they indicate the importance of financial aid highly in their decision to enroll at Bates. Hence, it shows the possibility that the students would stress about financial aid more in the survey when it has high importance in their presence at Bates.
Interacting with Professors as an International Student: Does it matter that I am a financial aid recipient?
In the section “Bates Academic Experience” of the International Student Need Assessment 2019, the survey asks the following question.
“Considering your ACADEMIC experiences at Bates, do you agree or disagree with the following statements? – Professors at Bates interact with international students differently than they interact with domestic students.”
Survey Question for the International Student Need Assessment 2019
For this question, we had five choices from “Strongly Disagree” to “Strongly Agree.” When we chose “Somewhat Agree” or “Strongly Agree,” we could indicate whether the interaction was positive, negative, or neither positive nor negative.
I found this question interesting because I remember struggling to answer this question very much in 2019. I had a professor who treated me as an interesting subject for his cultural studies. I also had a professor who avoided the conversation about my unique perspective. Then, I had professors who were very accepting of my background. Based on this diversity of interactions, I thought, ‘How am I supposed to answer this question? Would I have space to explain my experience elsewhere in the survey?’
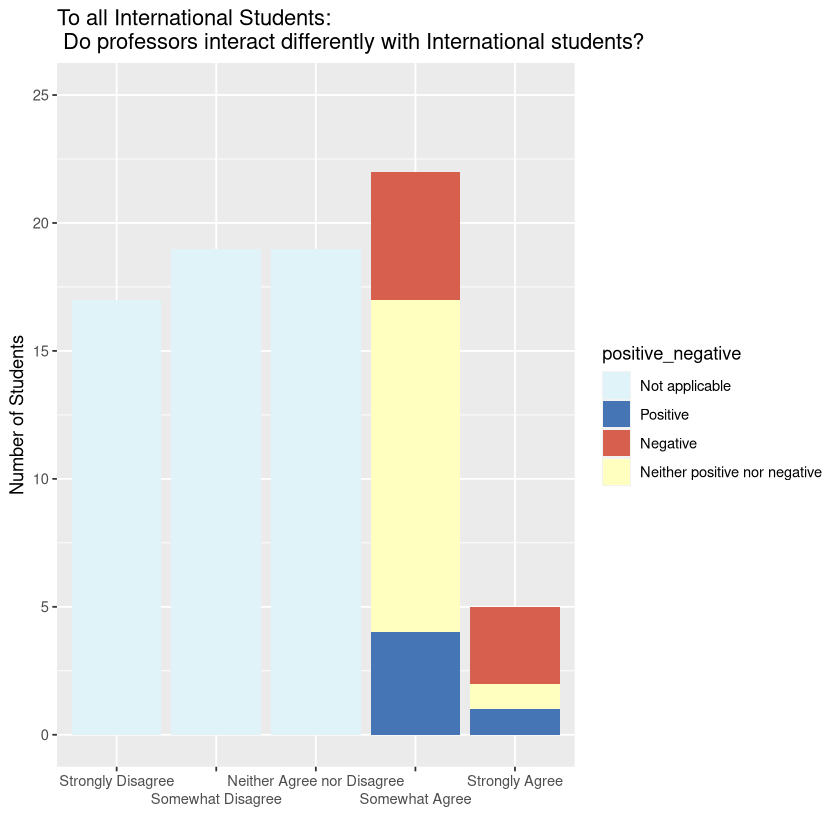
Let’s figure out how other international students navigate similar difficulties. Below is the response to the question among all international students (except one student who did not respond to this section)
#Data frame: fin_acad_2 is a data frame that merges financial (check the codes above) and new_academic. new_academic is a subset of the original data about the academic experience of Bates. It is "new" because it was translated in numeric value using the function agree_positive() and agree_negative(), which I had created. These two function translate "Strongly Agree" ~ "Strongly Disagree" to 1~5, or 5~1.) The column "professor_interaction" has the response translated from 1~5.

#creating a bar graph above about the number of students based on each response recorded in professor_interaction.

g <- ggplot(data=fin_acad_2, aes(professor_interaction))
g + geom_bar(stat ="count", aes(fill=positive_negative)) +
    labs(title = "To all International Students: \n Do professors interact differently with International students?", x = "", y = "Number of Students")+

#I change the x axis from 1~5 back to Strong Disagree ~ Strongly Agree
    scale_x_discrete(limit = c("1", "2", "3", "4", "5"),
                     labels = c("Strongly Disagree","Somewhat Disagree","Neither Agree nor Disagree","Somewhat Agree","Strongly Agree"),
                     guide = guide_axis(n.dodge=2))+

#This line determine the scale of the y axis
    scale_y_continuous(limit = c(0, 25))+

#I color the bar based the column postive_negative. This column tells whether the student considered the interaction with the professor as positive, negative, or neither positive nor negative. Since this option was not available to those choosing neither agree or disagree ~ strongly disagree, there is also "not applicable".

    scale_fill_manual("positive_negative",values = c("Not applicable"="#e0f3f8" ,"Positive"="#4575b4", "Negative"="#d6604d","Neither positive nor negative"="#ffffbf"))
#The code for agree_positive() is the following. The agree_negative() has the exact same code, except that I put the numbers in 1~5 order instead of 5~1
#This function have two parameters, the subset (data frame), and col(the index number of the column that you want to translate the string values to numbers)
agree_positive <- function(subset, col){
#I use the for loop to address all rows in the data frame.
for(i in 1:nrow(subset)){
#Every if statement checks whether the answer is identical to the string value that we want to consider. If it is, it saves the corresponding number on top of the original the row and the same column.
if(subset[i,col] == "Strongly agree"){
subset[i, col]<- 5
} else if (subset[i,col] == "Somewhat agree"){
subset[i, col]<- 4
} else if (subset[i,col] == "Neither agree nor disagree"){
subset[i, col]<- 3
} else if (subset[i,col] == "Somewhat disagree"){
subset[i, col]<- 2
} else if (subset[i,col] == "Strongly disagree"){
subset[i, col]<- 1
}
}
#It returns the changed data frame.
return(subset)
}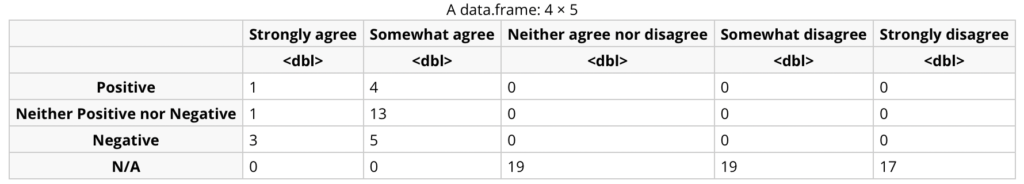
#I run a chi-square test to evaluate the statistical importance in the distribution of the answer. Every_mention is the data frame that includes all the response on the professor-student interaction, regardless of the number of mentioning financial aid in the response
chisq.test(every_mention)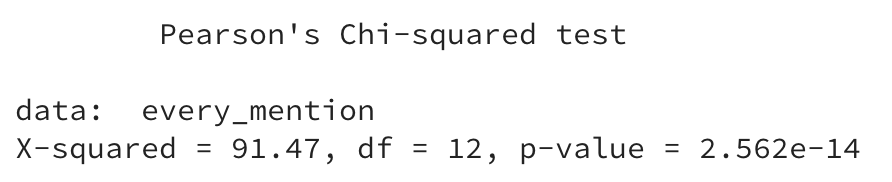
This bar graph demonstrates the variety of responses among the international students. Many students thought that professors did not distinguish between domestic and international students. However, we do not know whether the students consider the indifference as a positive or a negative to their academic experience at Bates. The majority of the students who answered “Somewhat Agree” reported that their experience was “Neither positive nor negative.” Yet, we need to recognize that neither positive nor negative does not mean neutrality. It may just signify that the experience cannot be explained within the provided binary scale. Finally, most students who strongly felt that the professor interacted with international students differently consider the interaction negative.
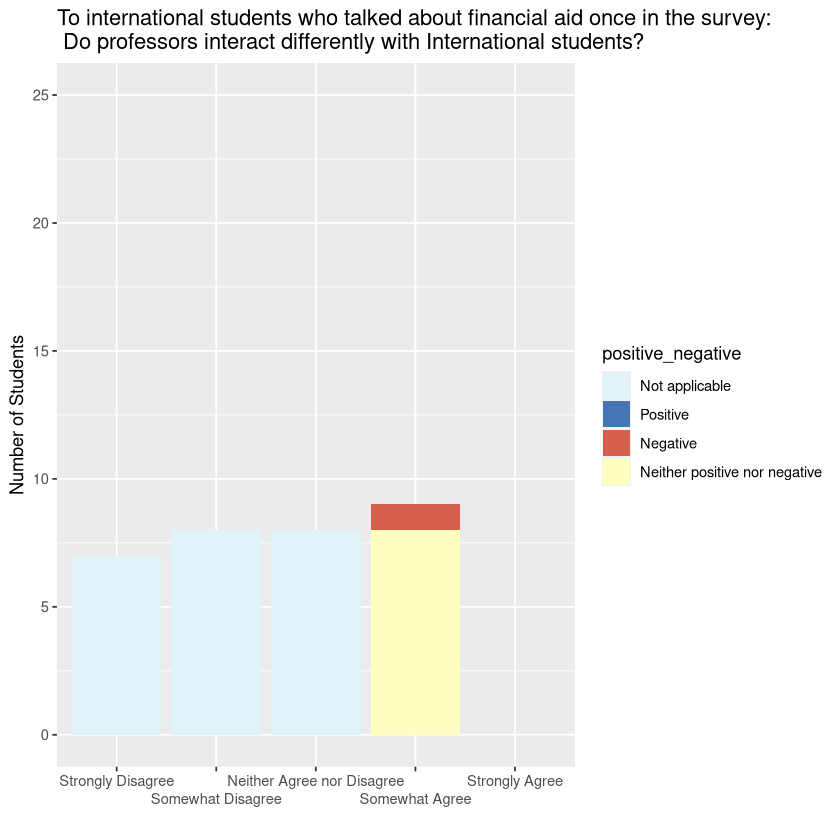
Would international students respond this question differently based on their relevancy to financial aid? Below, I divided the data based on the number of times that a student mentioned about financial aid throughout the whole survey response.
For the student who talked about financial aid once (1) in the whole survey
For the student who talked about financial aid twice (2) in the whole survey
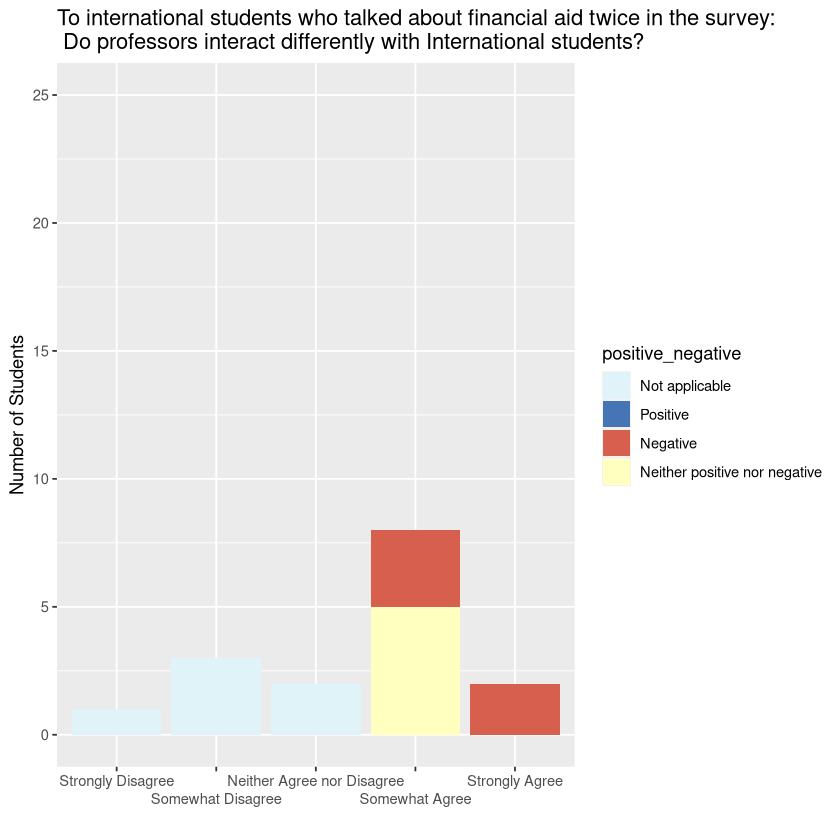
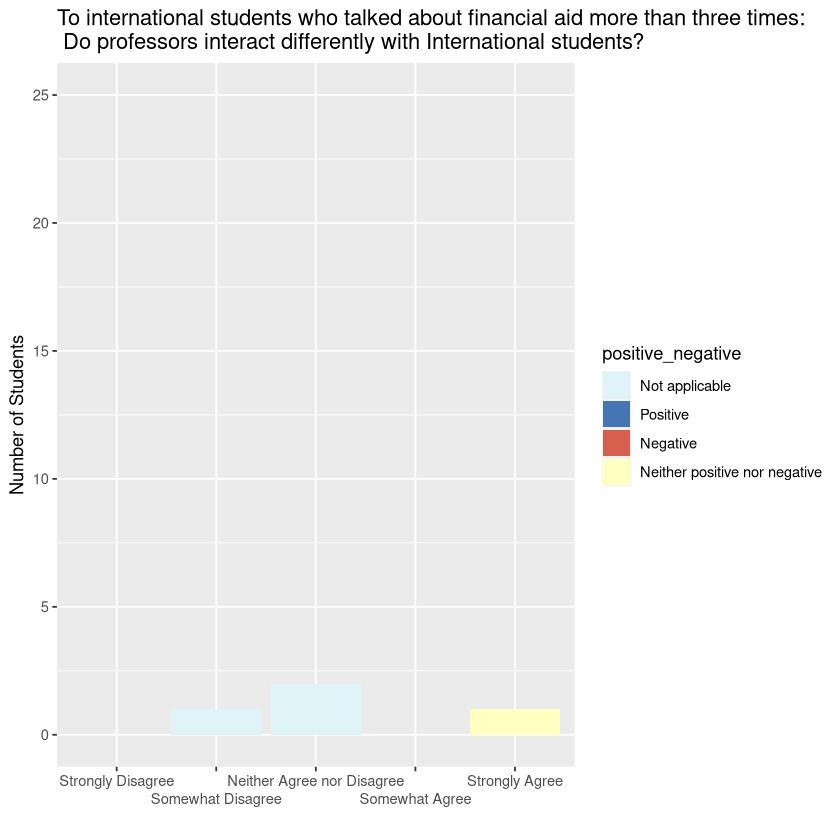
For the student who talked about financial aid three times (3) in the whole survey


#creating an subset based on the number of mentions for financial aid

fin_acad_3<- fin_acad_2[fin_acad_2$number_of_mentions==1,]
fin_acad_4<- fin_acad_2[fin_acad_2$number_of_mentions==2,]
fin_acad_5<- fin_acad_2[fin_acad_2$number_of_mentions>=3,]

#creating a bar graph for fin_acad_3, which includes all the rows that mention financial aid once.

f <- ggplot(data=fin_acad_3, aes(professor_interaction))

#I fill the bar based on the "positve_negative" column, which signifies whether the student considered the interaction either positively, negatively, or neither both ways.

f + geom_bar(stat ="count", aes(fill=positive_negative)) +
     labs(title = "To international students who talked about financial aid once in the survey:\n Do professors interact differently with International students?", x = "", y = "Number of Students")+

#I change the x axis from 1~5 back to Strong Disagree ~ Strongly Agree.
    scale_x_discrete(limit = c("1", "2", "3", "4", "5"),
                     labels = c("Strongly Disagree","Somewhat Disagree","Neither Agree nor Disagree","Somewhat Agree","Strongly Agree"),
                     guide = guide_axis(n.dodge=2))+

#This line determines the scale of the y axis.
    scale_y_continuous(limit = c(0, 25))+

#The color scale is manually determined as the codes above.
    scale_fill_manual("positive_negative",values = c("Not applicable"="#e0f3f8" ,"Positive"="#4575b4", "Negative"="#d6604d","Neither positive nor negative"="#ffffbf"))


#creating a bar graph for fin_acad_4, which includes all the rows that mention financial aid twice.

h <- ggplot(data=fin_acad_4, aes(professor_interaction))

#The aesthetic setting and the visual editing are equal to the graph of fin_acad_3.

h + geom_bar(stat ="count", aes(fill=positive_negative)) +
     labs(title = "To international students who talked about financial aid twice in the survey:\n Do professors interact differently with International students?", x = "", y = "Number of Students")+
    scale_x_discrete(limit = c("1", "2", "3", "4", "5"),
                     labels = c("Strongly Disagree","Somewhat Disagree","Neither Agree nor Disagree","Somewhat Agree","Strongly Agree"),
                     guide = guide_axis(n.dodge=2))+
    scale_y_continuous(limit = c(0, 25))+
    scale_fill_manual("positive_negative",values = c("Not applicable"="#e0f3f8" ,"Positive"="#4575b4", "Negative"="#d6604d","Neither positive nor negative"="#ffffbf"))


#creating a bar graph for fin_acad_5, which includes all the rows that mention financial aid twice.

j <- ggplot(data=fin_acad_5, aes(professor_interaction))

#The aesthetic setting and the visual editing are equal to the graph of fin_acad_3.

j + geom_bar(stat ="count", aes(fill=positive_negative)) +
     labs(title = "To international students who talked about financial aid more than three times:\n Do professors interact differently with International students?", x = "", y = "Number of Students")+
    scale_x_discrete(limit = c("1", "2", "3", "4", "5"),
                     labels = c("Strongly Disagree","Somewhat Disagree","Neither Agree nor Disagree","Somewhat Agree","Strongly Agree"),
                     guide = guide_axis(n.dodge=2))+
    scale_y_continuous(limit = c(0, 25))+
    scale_fill_manual("positive_negative",values = c("Not applicable"="#e0f3f8" ,"Positive"="#4575b4", "Negative"="#d6604d","Neither positive nor negative"="#ffffbf"))
First of all, we can notice that the blue bar disappeared in the three graphs. The blue bar was supposed to indicate those that had a positive experience when the professor differentiated international students from domestic students in its interactions. None of the students who talked about financial aid in the report voted that their experience with professors was generally positive. (when the professors were interacting differently with them) In fact, the report of generally negative experiences was as prevalent as those who said that it was neither positive nor negative in the second graph. This result may infer that students who a) thought that professors interact differently with international students and b) discussed financial aid often tend to find the professor-student experience negative.
#Changing the type of the column professor_interaction to numerical type to run the Wilcox Test

fin_acad_3$professor_interaction <- as.numeric(fin_acad_3$professor_interaction)
fin_acad_4$professor_interaction <- as.numeric(fin_acad_4$professor_interaction)
fin_acad_5$professor_interaction <- as.numeric(fin_acad_5$professor_interaction)

#Running the Wilcox Test across each graphs to check whether the mean of each subsets are different enough to be statistically significant.
#We use the Wilcox Test instead of the t-test because the data are not normally distributed.

#Wilcox Test for the students who answered about financial aid once and those answered twice.
wilcox.test(fin_acad_3$professor_interaction, fin_acad_4$professor_interaction)

#Wilcox Test for the students who answered about financial aid once and those answered more than three times.
wilcox.test(fin_acad_3$professor_interaction, fin_acad_5$professor_interaction)

#Wilcox Test for the students who answered about financial aid twice and those answered more than three times.
wilcox.test(fin_acad_4$professor_interaction, fin_acad_4$professor_interaction)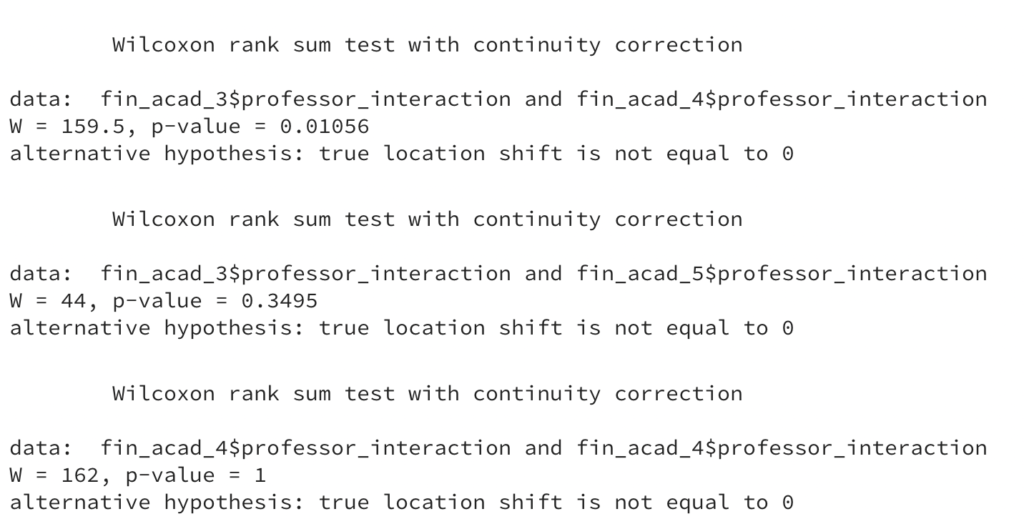
In addition, we can observe that the graphs skew to the right as the students talked more about financial aid. The right section of the graph refers to a greater distinction between international and domestic students in professor-student interaction. Indeed, the Wilcox Test exhibits that students who responded about financial aid once and those who talked it twice have a statistically significant difference, meaning that something may be influencing the result of the two distributions. (All the comparisons with the group that mentioned financial aid more than three times did not have a statistically significant result. It may be due to the insufficient number of samples.) Thus, we can suspect (but not conclude) that international students who mentioned more about financial aid in the survey thought that the professors interact differently between international and domestic students.
Conclusion: so could we say that being a financial recipient (or having concern about financial aid) affect your interaction with professors? (Well, not really, yet)
The research data shows that there is some possibility that receiving financial aid may be relevant to your Bates experience. At first glance, it seems like that the more you are interested in financial aid, the more you would recognize the professors reacting differently to international students in a negative way. Nonetheless, they are other factors that could affect the result.
- Although no publicized statistic exists, everyone in the international circle knows that students of a certain nationality receive less financial aid than others. They also take an exceptionally large population in the international population compared to others. Hence, we should consider factors like nationality or race influencing the result, as much as the student’s interest in financial aid (or their socioeconomic status).
- What does it mean to evaluate an interaction as “neither positive nor negative”? Do international students truly feel indifferent to the interaction? Is there something more complex happening? We need to study more about the nuances of the responses. Fortunately, thanks to the full report of the International Students Need Assessment, we have some idea of what students meant by referring to a negative or positive experience with the professor. However, the quotes on this report were not from the students who responded interactions with professors as positive or negative in the survey.
“There were eight respondents who described the difference in how professors treated international students as “negative,” noting that they “felt left out in class conversations” and “as if we’re slower to understand.” Students felt professors “ignore the non-U.S. aspect of my argument” or “call on you to address certain questions about the region of your country…I cannot speak for the entire [region].” Five respondents described the difference in treatment as “positive,” noting that the “passion of professors to teach their subjects” was a key reason for choosing to come to Bates. Students also identified professors as resources for academic and non-academic support as well as suggesting that “talking to professors” would be a beneficial element of an orientation for international students.”
– International Students Need Assessment 2019
Finally, we should also question the effectiveness of this question to comprehend international student experience. Depending on the circumstance, a student may prefer professors differentiating them from domestic students or the other way around. This question also may be a philosophical inquiry: one may ask, “is it morally desirable/acceptable to interact with students differently based on their nationality?” This vagueness of the interpretation may suggest that it was not the perfect question to capture the experience of the international students at Bates.